USA: Women in state legislatures 2022
Source: CAWP
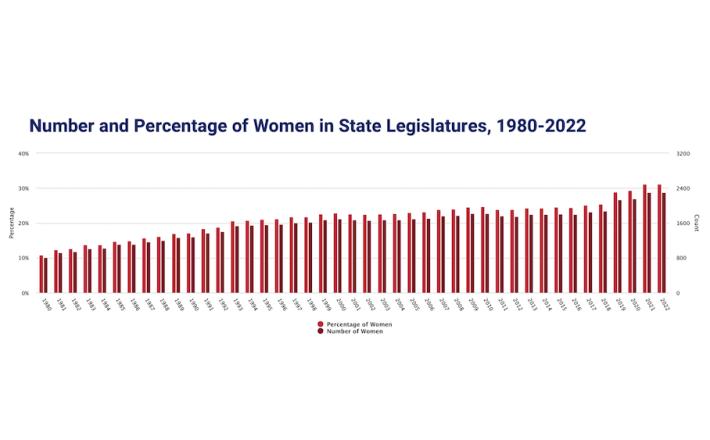
Number and Percentage of Women in State Legislatures, 1980-2022
[[{"fid":"20338","view_mode":"media_original","fields":{"format":"media_original","field_file_image_alt_text[und][0][value]":"Number and Percentage of Women in State Legislatures, 1980-2022","field_file_image_title_text[und][0][value]":"Number and Percentage of Women in State Legislatures, 1980-2022"},"link_text":null,"type":"media","field_deltas":{"2":{"format":"media_original","field_file_image_alt_text[und][0][value]":"Number and Percentage of Women in State Legislatures, 1980-2022","field_file_image_title_text[und][0][value]":"Number and Percentage of Women in State Legislatures, 1980-2022"}},"attributes":{"alt":"Number and Percentage of Women in State Legislatures, 1980-2022","title":"Number and Percentage of Women in State Legislatures, 1980-2022","class":"media-element file-media-original","data-delta":"2"}}]]
Current State Legislature
2,300
(1,516D, 764R, 13NP, 5Ind, 2Prg)
31.2% of 7,383 seats
Since 1971, the number of women serving in state legislatures has more than quintupled.
NP = non-partisan, Ind = Independent, Prg = Progressive
State-by-State Summary Data on Current Women State Legislators
Click here to access the data.